Report Manager
Dennis Mergemann (Unlicensed)
Jennifer Geers (Unlicensed)
You already know the Report Manager - at least by name. A Report Manager is used in Reporting+, TIVIAN‘s all-in-one solution for the evaluation of results in EFS Survey and EFS Panel projects. However, while this fits in with an application scenario that primarily requires single and non-individualized report orders, the new namesake relies on these Employee use cases, i. e. the mass generation of reports. So there is a lot of information behind a simple homonymity.
The possible uses of the new Report Manager are by no means limited to a scenario dominated by the mass generation of reports, but cover a requirement range that extends from a single report to a mass generation of approximately 40000 reports. You are not liable to any regulations.
You have to show some click effort when you pass through the Tagging Tool, a Power Point Add In, until you upload the generated reports to EFS Employee. The Tagging Tool tags tables, charts and text cells so that they can be used in the Report Manager. The tagged PPTX file will be uploaded in the template library where it can be used for the Report Definition.
Under the native user interface of the Report Manager, there is a computing core whose performance capability allows the Data Voyager Analyst to traverse the data space in an extremely flexible manner. The Dataspace Entity is a protagonist of this departure in the new Report Manager, which you will meet when creating the Report Definition.
You stick to her in order to relate units to each other with the aid of the Data Space Query (DSQ). So you depict a deployment. You are able to depict trends by relating a unit from the historic wave to one of current wave.
After publishing the Report Definition you skip to the Report Order. There are three types of reports to choose from: Ad Hoc Report, Standard Report and Condition based Report. After a successful generation, you distribute the reports to EFS Employee or download them as PPTX and/or PDF files. In addition, you have a module in Portals to provide reports.
Tagging Tool
Before every trip you take precautions that not only complicate the course of events if they are omitted, but also make your trip completely impossible. The same goes for exploring the data space. The Report Manager also asks you to take such preparatory action that you will hardly be able to set off on your exploratory journey if you fail to do so. But how do you prepare yourself for spacey trip with the Report Manager? Via Tagging Tool you prepare the PPTX shapes, in order to enable the filling of the table, the diagram and the text cells. Each cell gets a tag so that it can be used for the mapping later when the Report Definition is created. In the following chapter you will learn about this indispensable tool from the user interface to the concrete application.
The Tagging Tool is a Power Point Add In and once installed, it can be found in the Power Point menu bar under Add Ins. Like any desktop software, it can be installed by double-clicking on the installation file.
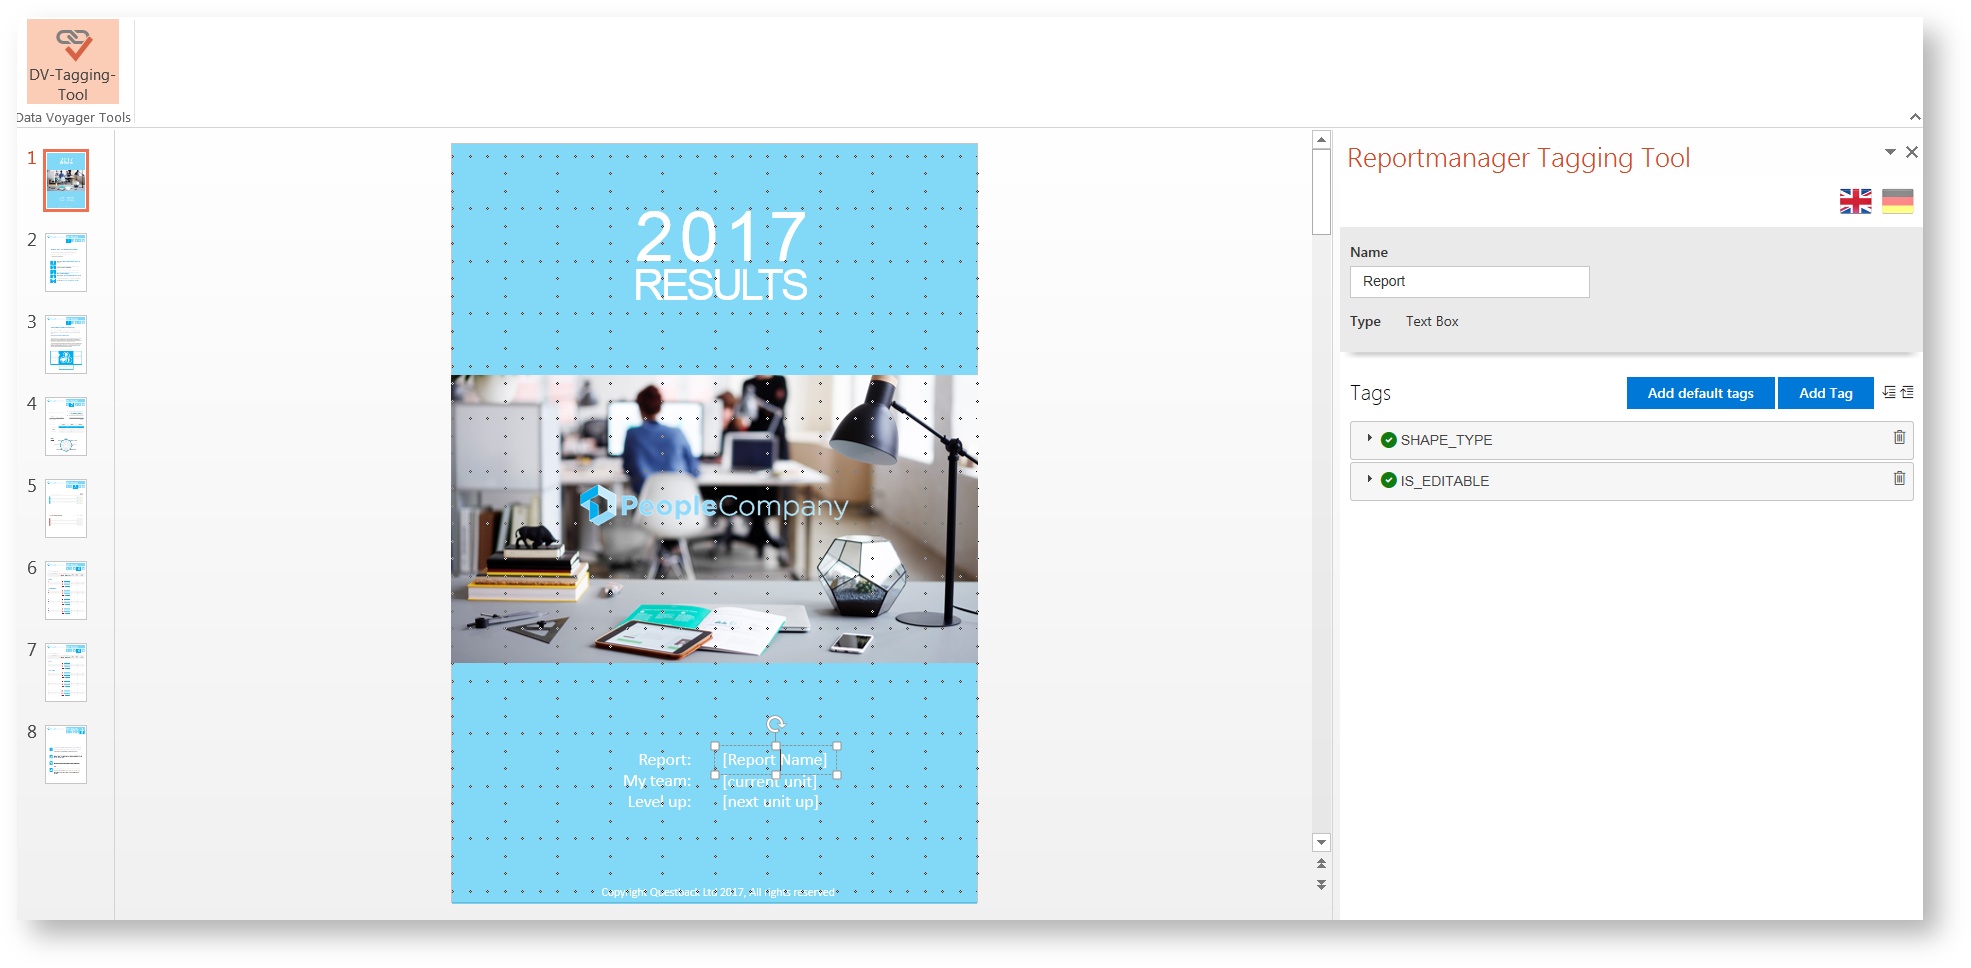
The user interface
You click on the tab DV Tagging Tool and you orientate yourself towards the control panel which is inserted from the right.
- There you will first discover the language selection symbolized by flags. You can choose between English and German.
- Overhead you find a drop-down list with which you can move, resize and close the tool. You can close the tool with the adjacent X button, too.
After clicking on the shape cell to be tagged, the Tagging Tool switches to the working view, which is divided into two visually seperated areas: the information area and the tagging area.
The information area
The upper area is the information area. The information area contains the shape name that you can change and the information about the shape type.

The tagging area
The tagging area is preceded by two buttons: Add default tags and Add Tag. Next to the two buttons there are two icons with which you can open or close all tags.

The main focus in this area is on the tags you create with the two buttons. Once the tags have been added, they are listed one after the other. Each tag has the following functionalities:
- a drop-down arrow that opens the input lines to enter the name and the value
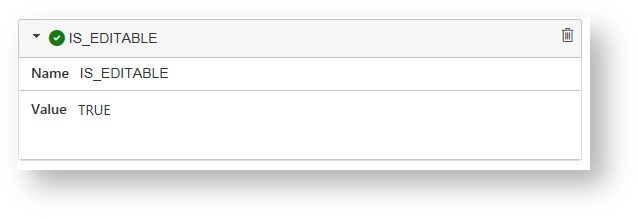
- an icon that informs you whether the tag is valid or not
- a trashcan icon in order to delete the tag
- a table icon to tag table and chart cells
The button "Add Tag"
You start the tagging by clicking on the button Add Tag. The two input lines are opend up and you continue with the following steps.
- You enter the name and the value of the tag.
- By means of the drop-down list you enter the name. The value is added automatically.

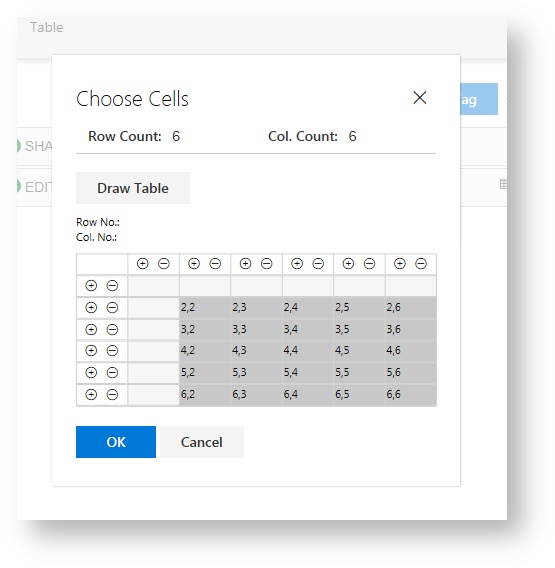
You use the table icon to select the single cells, columns, and rows of the tables and diagrams that you want to make available of the Report Definition.
- You select a single cell by clicking.
- By means of the plus and minus charakters (in the column header and the header row) you control the selection of the desired rows and colums.
The button "Add default tags"
This button saves you time. If you click on Add default tag, the tags for the selected PPTX shape are set automatically. Consider the following:
- All cells of a table are tagged. You may have to remove one or two tags.
- Rows is the default value of the Loop mode tag. If you want to set Columns as the value, you have to change it.
Names and values for possible tags
The names and values that can be used are listed in the following table. You find the names in the header and the values are listed in the column.
Name: | Shape Type | Is_Editable | Loop Mode | Shape Name | Shape description |
|---|---|---|---|---|---|
| Chart | True | Columns | Text Box | Text Box | |
| Table | - | Rows | True | eigener Beschreibungstext | |
| Text Box | - | - | eigener Beschreibungstext | - |
The tagging of a table and a chart
The important elements of the reports are tables and charts. In the following way you add the tags:
- The second tag receives the Name EDITABLECELLS.

- For setting the value you click on the table icon. By the means of the modal you select the required cells, columns and rows.
- You confirm your selection with OK. For the purpose of cancelation you make use of the tab Cancel. You close the modal with X.
.png?version=1&modificationDate=1559026461501&cacheVersion=1&api=v2&effects=drop-shadow&width=450&height=461)
- The tagging of a chart runs analogously. Instead of TABLE you set CHART in the first tag. In the second tag you have to make a choice regarding to the cells, rows and columns.

- The shape name can be modified in the upper section, Because of that you are able to identify the shapes much more easier in the Report Manager. Finally they are displayed in any internal order.

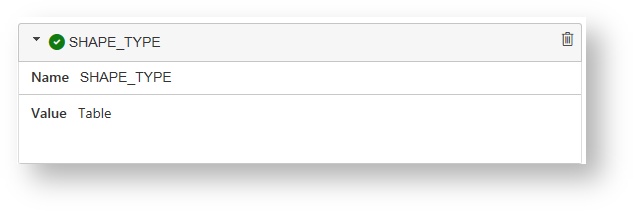
- You start with the setting of the shape type by setting SHAPE_TYPE as the name and TABLE as the value.
- The same applies to the page names. If you click on a page in the left area, you can modify the name. This will be transfered automatically be creating a Report Definition from PPTX template.
The tagging of description
For example, you use the Description to depict a description in the Report Manager of how the shape cell is to be filled. You can always add such a tag.
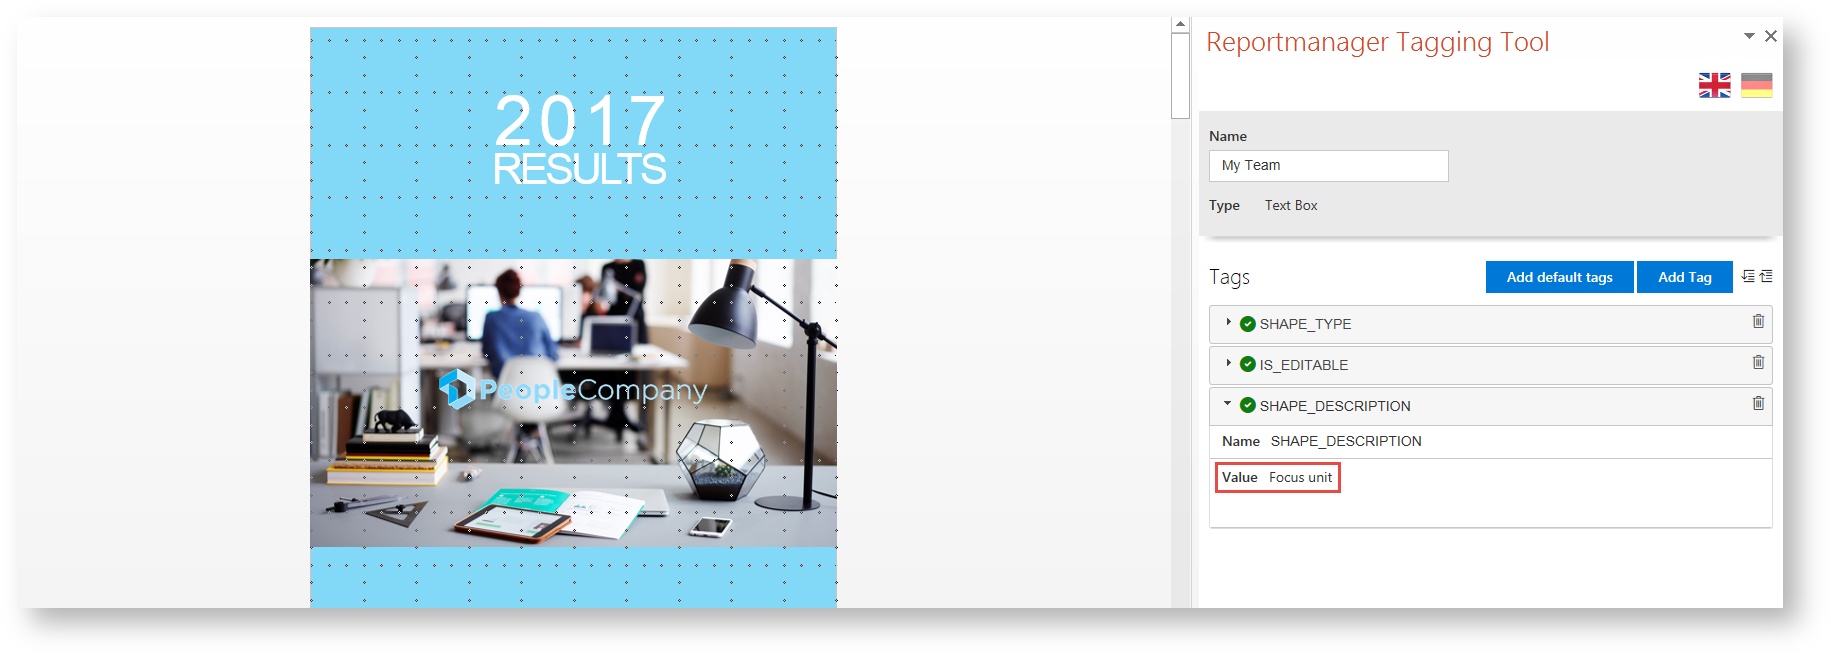
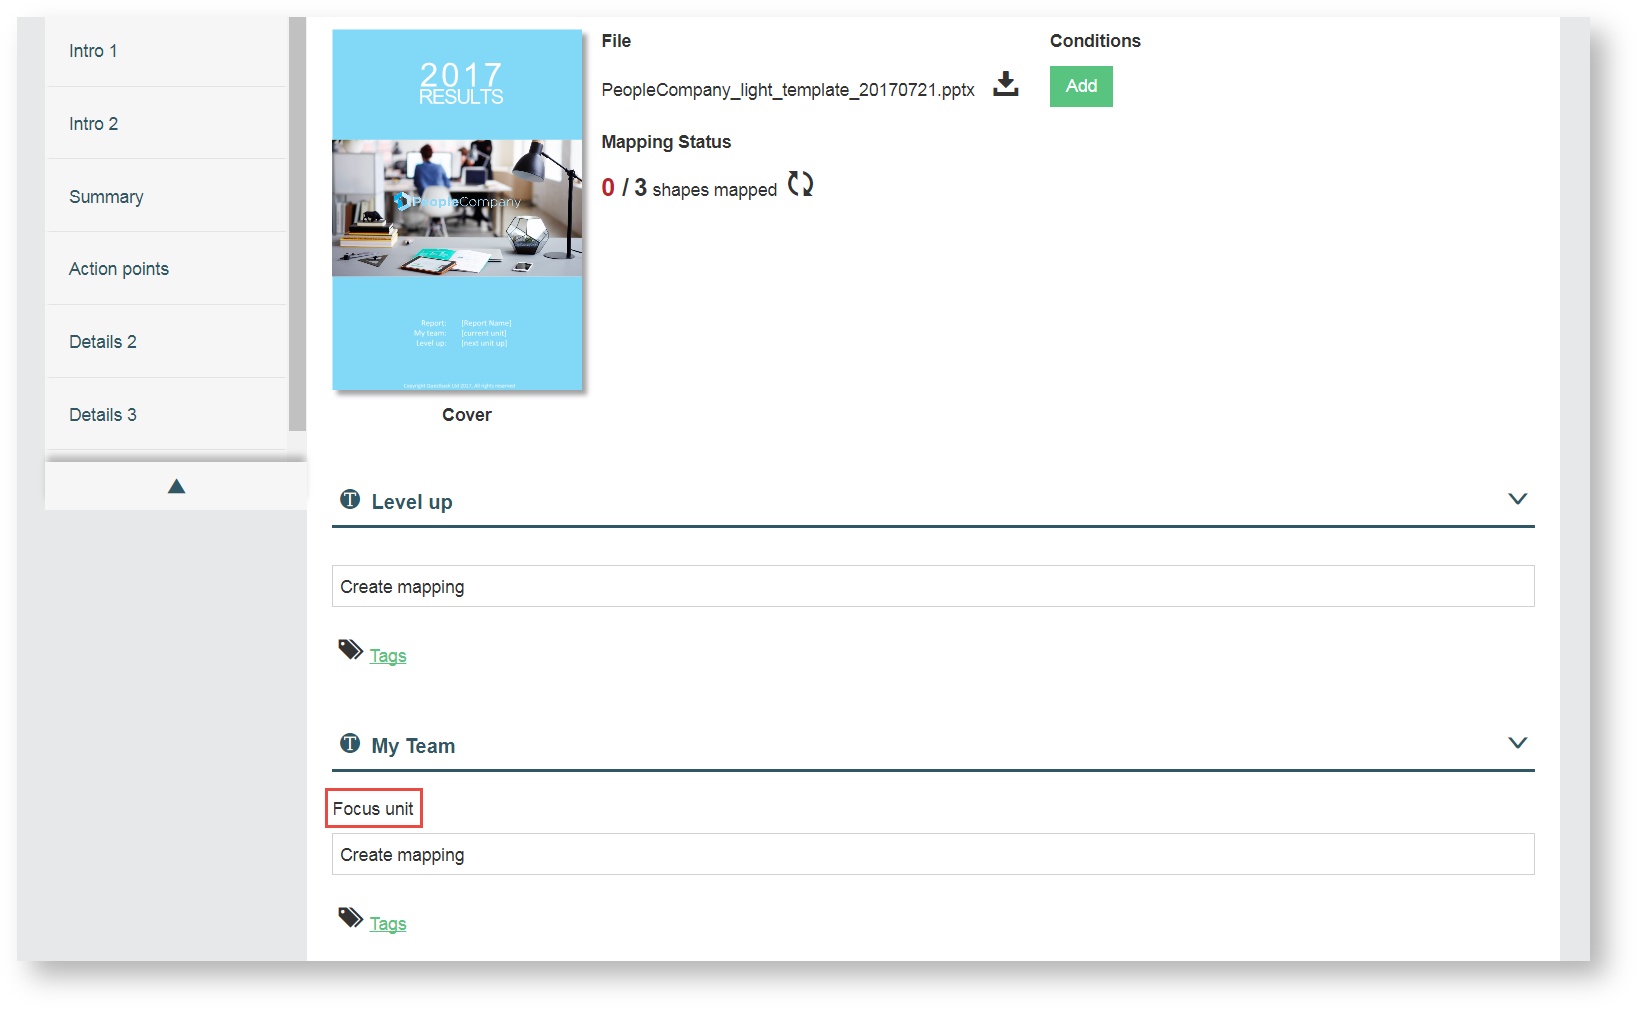
- For this you use Shape_Description as the name and use the value the requested text description. For example, if you enter "Focus unit" as a reference to the unit element to be selected for the cell, this note is displayed in the Report Manager.
The tagging of text box
You tag a shape cell with Text Box to ma this cell for example with a label in the mapping on the sub-navigation filed Pages.
- You click on Add Tag in the Tagging Tool.

The tagging of the Loop mode
In order to use the Loop mode on the sub-navigation field Pages you create three tags. Of course you are able to create a fourth one. It is the description tag which serves you as helpful description of the elements.
- Again you start by setting the shape type: You enter Shape_Type as the name and Table as the value.
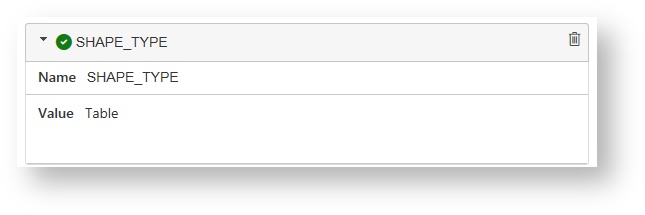
- In the second tag you set Loop_Mode as the name and you set as the value the way it should be looped: rows or columns.

- The third tag contains the information which cell will be mapped. Again you start with the name and you enter EDITABLECELLS. In order to set a value you select the cells which should be mapped. For this you use the table icon.
- Necessarily you have to select the whole column and the whole row to activate the Loop mode.

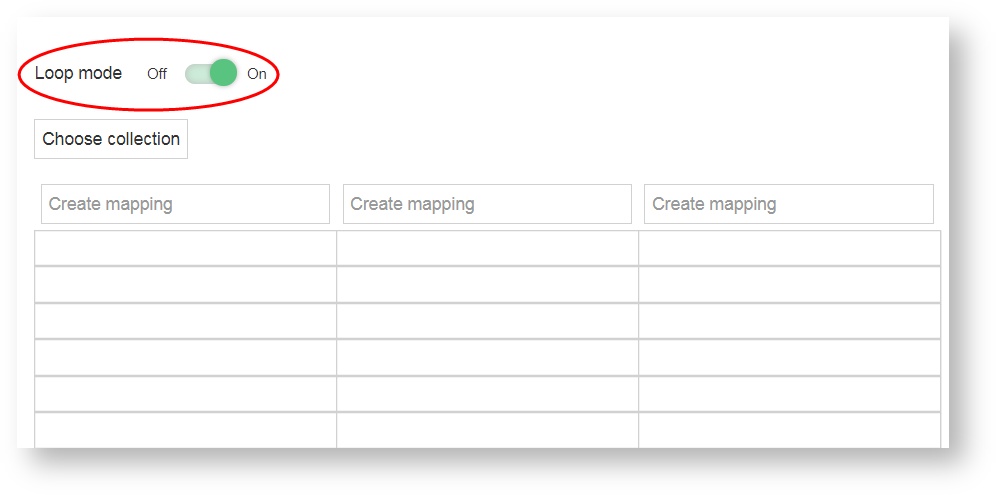
- Due to this definition a slide switch appears in the Report Manager which you use to activate the Loop mode.
Information
Both the Dimension and the Unit collection are iterated either via the row or the column. If you use Rows as the value for the Loop mode tag, the values are filled row by row into the cells automatically. If you use Columns as the value for the Loop mode tag, the values are set column by column next to each other automatically.
Starting page
All preparations are completed and the first milestone beckons promptly: the upload of the PPTX file prepared with the Tagging Tool. You manage this under the Libraries tab on the Setup page. Previously you view the new environment and get to know the important tables, menues, buttons and the tiles. After these first steps you will reach the navigation area of the Report Manager, where you do all the relevant settings and you can add a Dataspace entity that can be used in the mapping. But this is not the end of your journey. Before you hit the home stretch and distribute the reports, you have to complete the Report Order.
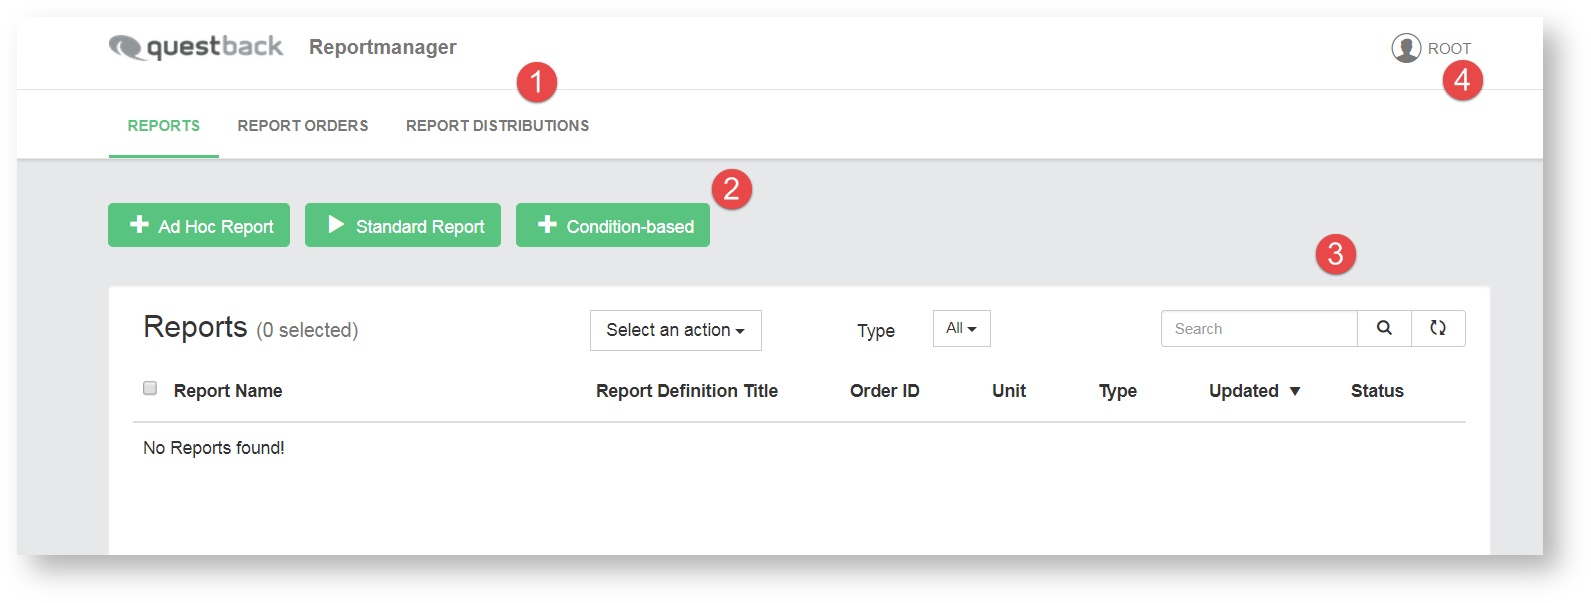
As soon as you get to the front page you have to move on to the Setup page by using the user menu in the upper right-hand corner. And that is how you penetrate into the heart of the Report Manager, the creation of a Report Definition. But it is a good idea to familiarize yourself with front page first. You use the different functionalities of the page for the Report order and the Report distribution. From the left to the right you see:
- Menu bar
- Report types
- Table
- User menu
The menu bar
The logo at the top can be adjusted together with the coloring of the buttons to your corporate identity. You see the following tabs:
- Reports
- Report Orders
- Report Distributions
Information
Only under the Reports tap you are able to get access to three report types: Ad hoc Report, Standard Report and Condition-based Report.
The three report types
The three report types are used for reporting purposes. Among other things, they differ in the choice of the focus unit:
- A virtual unit can be defined as a focus unit for the Ad hoc report.
- The Standard Report is utilized to order individualized reports for several focus units simultaneously. By the means of the select box you have the possibility to order reports for all the sub units at the same time.
- For the condition-based Report you select more than one focus unit by using property filters, You can define up three filters.
The report table
Under the tab Reports, in the center of the front page, you will find the report table that lists each report ordered for a unit. An order can consist of several reports. In the header of this table you find the column headings sort by:
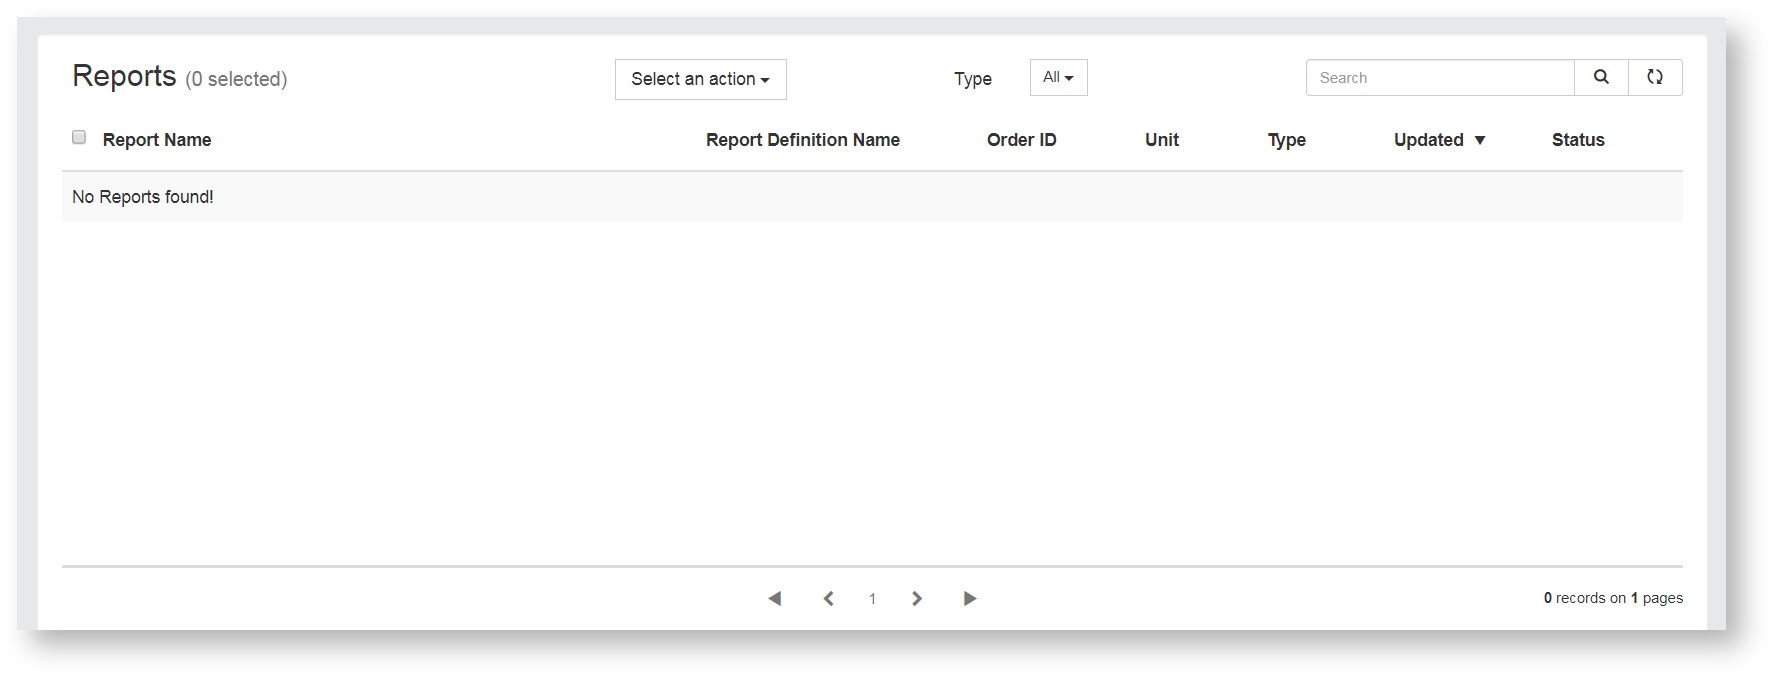
- Report Name
- Report Definition tile
- Order ID
- Unit
- Type
- Updated
- Status
"Status" is subdivided into:
- Created
- Calculating
- Rendering
- Ready
- Failed
- Retry
If report generation failed for the first time, the button Retry appears in the column "Status". Clicking on it opens a modal that informs you about the details of the failed generation. As soon as the generation fails three times, the report changes from the status "Retry" to the status "Failed".
Via mouseover the line of the respective report is highlighted. So you are able to select one of the three options: the immediate download of the PPTX file and/or the PDF file, the deletion and the distribution of the reports.
The table has the following functions:
- Check boxes allow you to check the reports either individually or as a complete selection. The selected reports can be deleted, downloaded or distributed using the selection box Select an action.
- The operation Type can be used to filter by the ordered report types.
- The search function allows you to search for the metaname and the report name.
- You can use the refresh button to update the table.
The report order table
A further table can be found under Report Orders. This table lists the report orders made. An order may contain several reports. The orders are sorted by:
- Order ID
- Report Definition Name
- Report Definition ID (optional)
- Order Type (optional)
- Order Date (optional)
- Ordered by (optional)
- Order State (optional)
- Total Reports
- Created (optional)
- Retry (optional)
- Calculating (optional)
- Rendering (optional)
- Converting (optional)
- Completed (optional)
- Failed (optional)

You can use the following functionalities:
- You click on the refresh button to update the table.
- You can scroll using the scroll bar.
- You can also show and hide columns using the table icon.
Each order has one of the statuses that you can find in the column "Order state":
- Created
- Paused
- In Progress
- In Cancellation
- Cancelled
- Done
- Deleted
Initially, every order is set to the status "Created".
The report order management
The report order management gives you direct access to processing of an order. This saves you time, especially in the case of orders that contain large quantities of reports to be generated. If a report definition turns to be in need of correction, the report order management allows you to cancel and to delete the corresponding order. Of course, you are able to pause an order and check any possible changes before placing ist. You continue the processing with Resume.

Via mouseover, the icons available in the current status of the order will appear in the rows of the report order table to control the possible actions. All in all, you have the following actions:
- Pause
- Resume
- Cancel
- Delete
This means for the order status:
- If you click on Pause, the status of the order is changed to "Paused". Resume reomes the order state "Paused" again.
- If you click on Cancel, the status of the order is changed to "In Cancellation" first and set to "Cancelled" afterwards. You must confirm the cancellation of an order via a confirmation modal. The reports with the status "In Process" are terminated while the reports with the status "Created" are transferred dircetly to the status "Failed".
- If you delete an order, the status of the order does not change. This is removed directly from the order table after you have confirmed the action via a confirmation modal. The deleted reports can no longer be found in the report table under the rab Reports.
Not all actions are available in every status. The icons of the unavailable actions are not displayed accordingly. Consider the following:
- You can only delete orders that have the status "Created", "Cancelled" and "Done".
- You can cancel the order that is in status "Creaed". "Paused" or "In Progress".
- You can pause the order that is in the status "Created" or "In Progress".
Information
In principle, only those report orders that have the status "Created" can be canceled or paused. Explanatory, however, must be added: The individual reports of an order are processed one fter the other. While some reports already run through the three report statuses "Calculation", "Rendering" and "Converting", others are still in the status "Created". The status of the report order is set to "In progress". If you pause or cancel an order now, this action only applies to the reports that are still in the status "Created", while processing of the remaining reports continues until they set to the status "Completed" or "Failed".
The report distribution table
The report distribution table is displayed under the tab Report Distributions. The table icon allows you to fade in and out certain columns. You check the columns either individually or as a complete selection. To the left of it you find the button to refresh the table. This table lists the distributed reports.
he distributed reports can be sorted by:
- Report type
- Report definition name
- Report definition id
- Ordered by
- Ordered for
- Distribution state
- Locale
- Lang label (optional)
- Report title (optional)
- Report id (optional)
- Project title (optional)
- Log date
- Logmessage
User menu
The user menu is located in the upper right hand corner of the screen, as on all pages of the Report Manager. You use the menu to:
- select the language
- log off
- switch to the setup page or switch back again
- jump to the EFS Online Documentation
In the case of the language selection, you choose between German and English.
Setup page
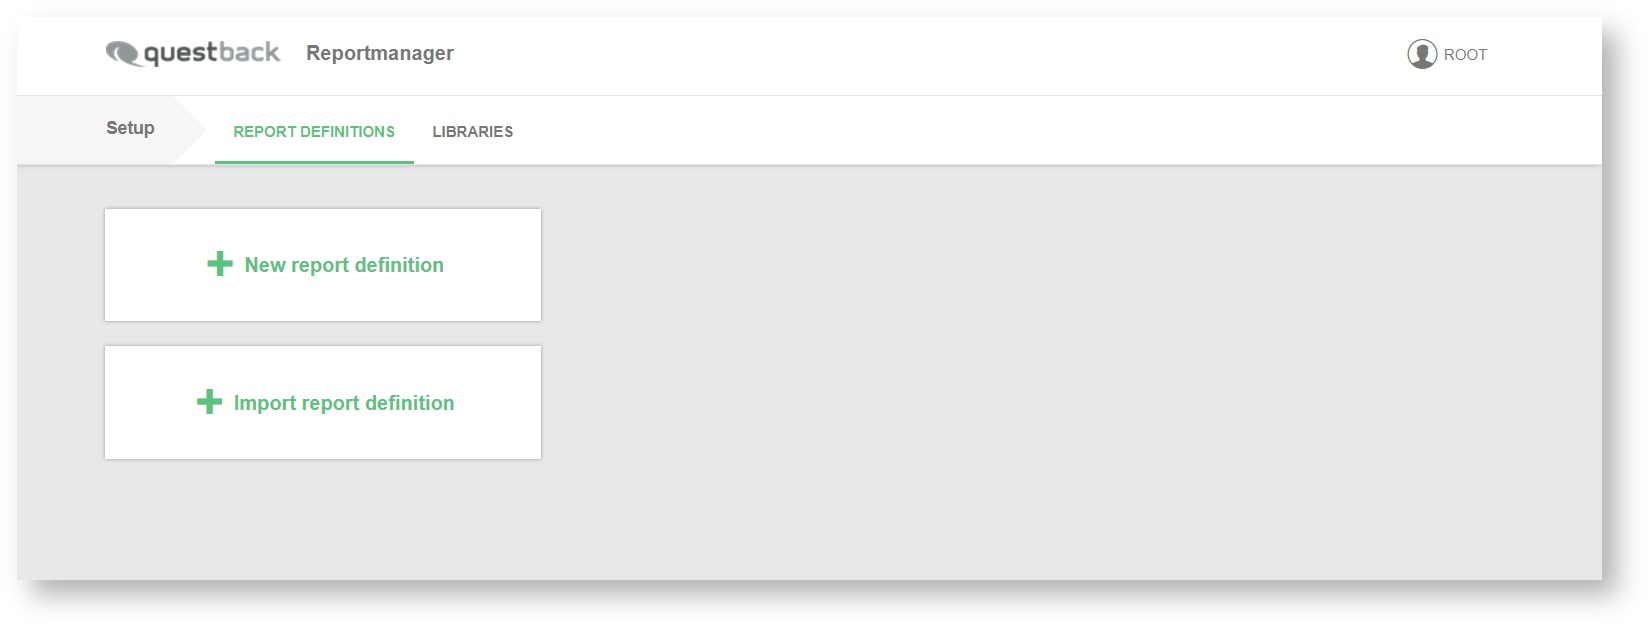
You do not stay on this page under the tab Report Definition for longer than you need to spend time to get an overview. Four new controls strike the eye:
- two tabs
- Report Definitions
- Libraries
- two tile buttons:
- + New report definition
- + Import report definition
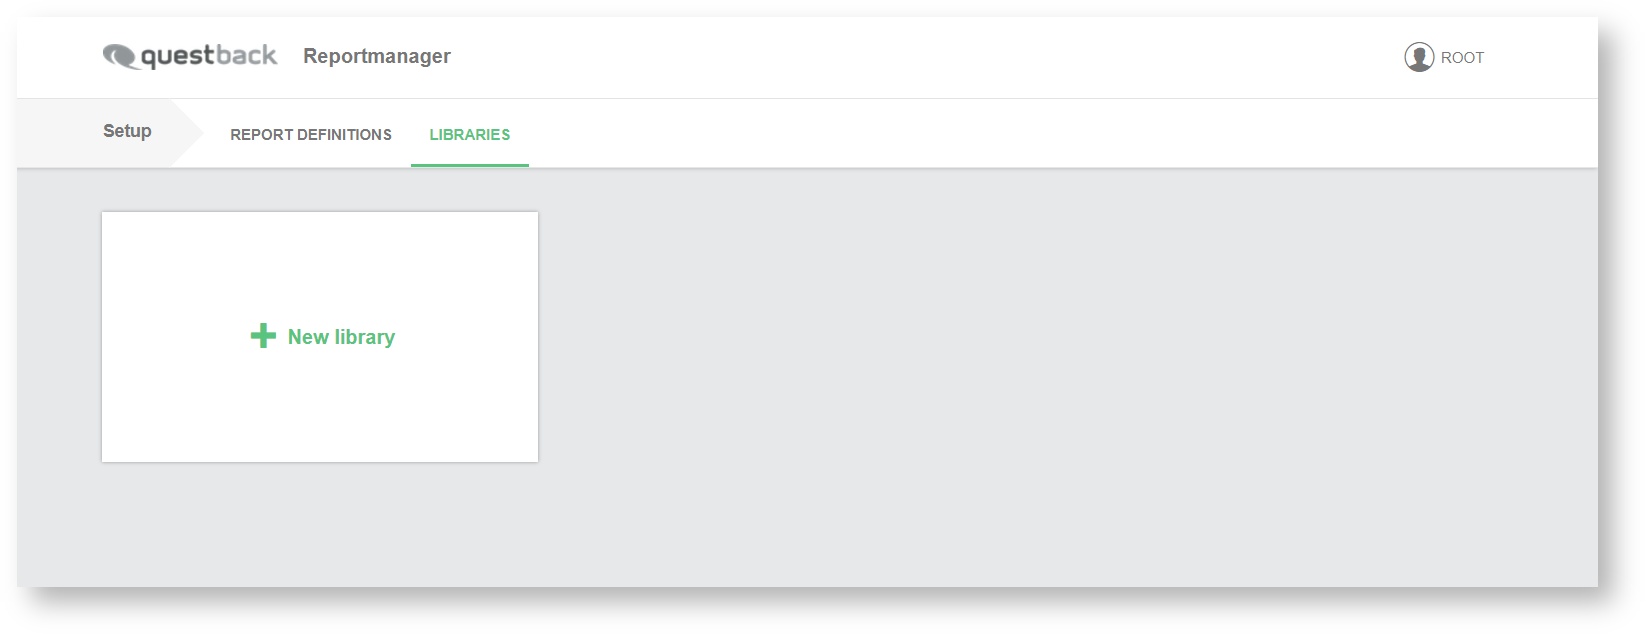
As soon as you change the tab, you will find another tile button under Libraries:
- + New library
Successive you cklick on the following controls to upload the PPTX file prepared by the Tagging Tool:
- + New library
- library template tile (red framed)
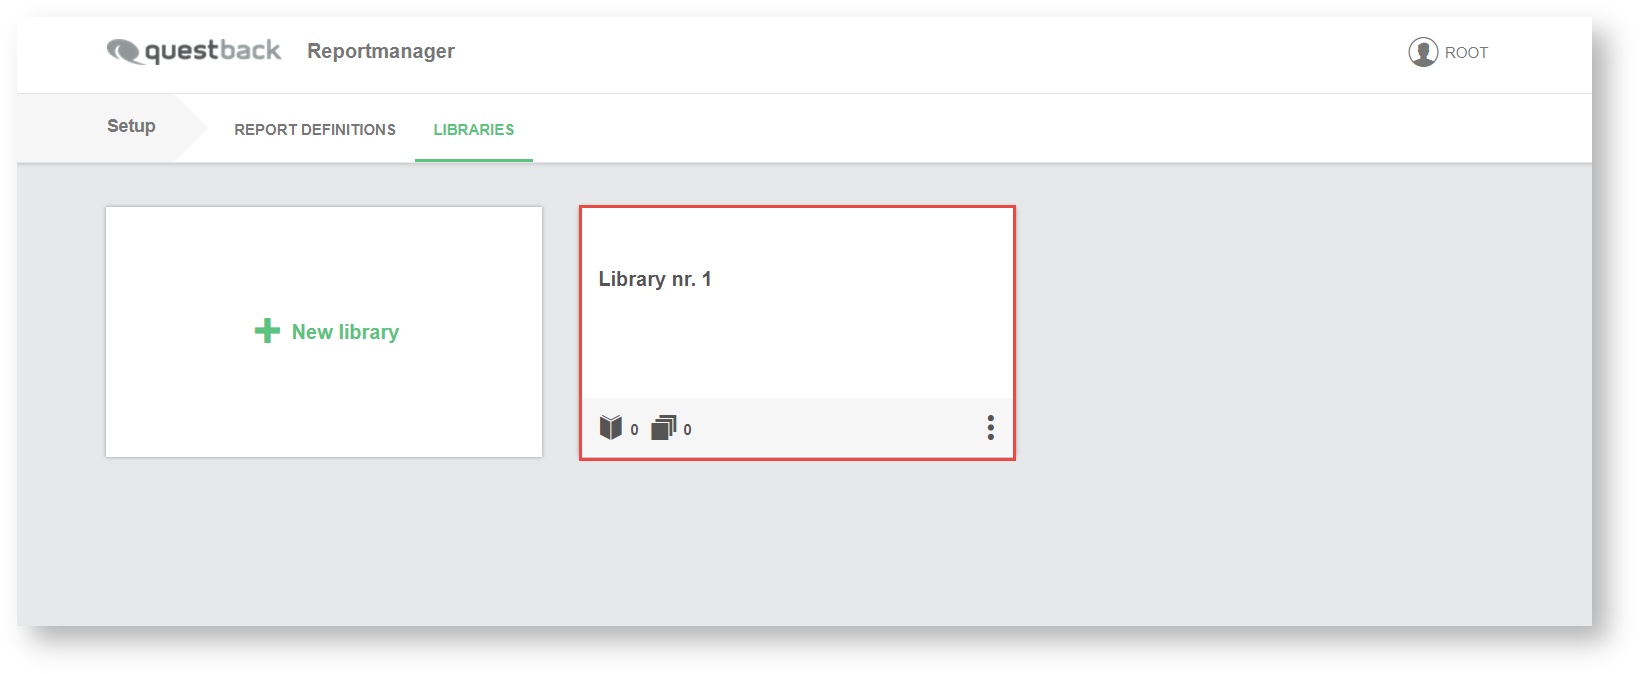
You click on the tile and you end up in the template library.
- + New file (PPTX)
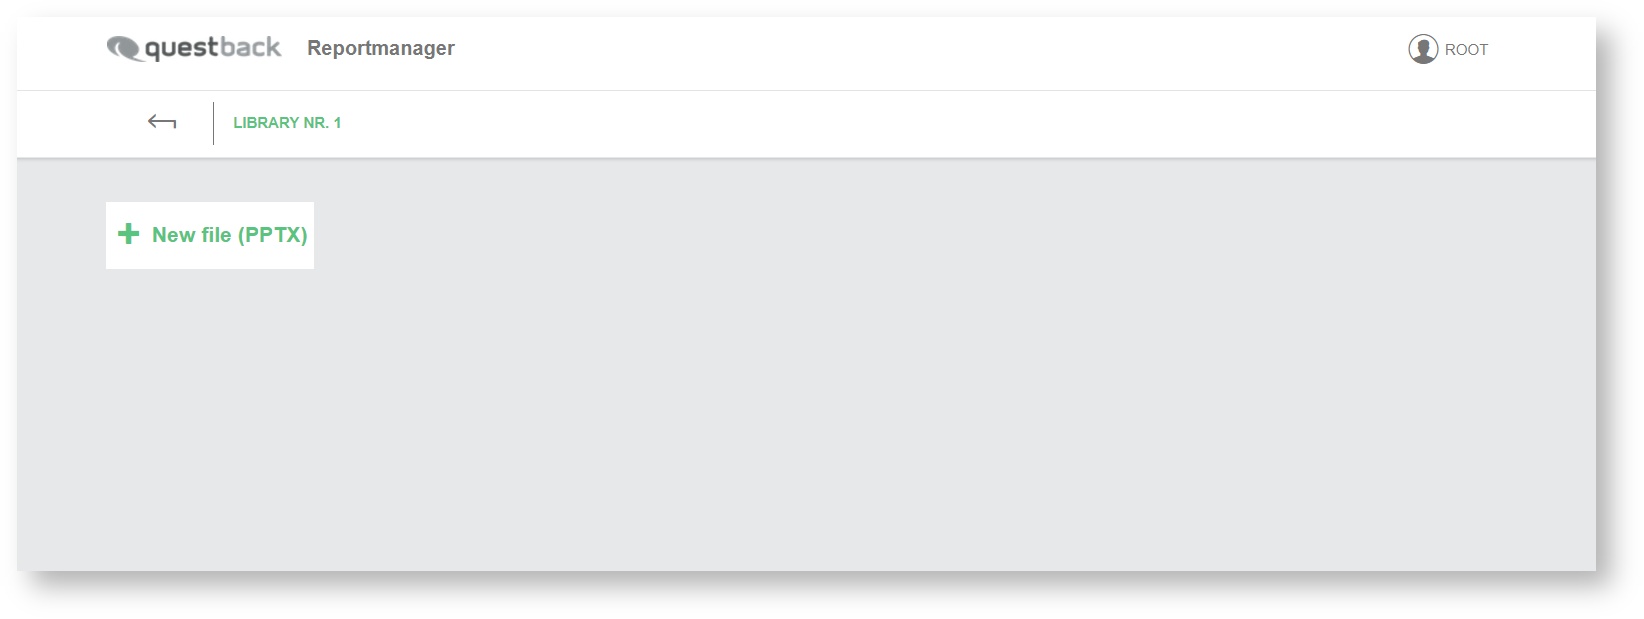
In the pop up window you can select the desired PPTX file and this is uploaded to the library as a template and displayed there.
Buttons of the Report Manager
In addition to the two tile buttons on the setup page under the tab Report Definitions there are other important buttons. You use these buttons for the following actions:
- You use the button + New library under the tab Libraries to create a new library.
- You use + New file (PPTX) to upload a PPTX file under the tap Libraries.
- As the name suggests, you use + Import report definition to import an existing Report Definition.
- You click + New report definition to create a new Report Definition.
- You use the button + New page to add a knew page to the report. The button can be found on the report overview page.
Tile layout I: library template tile
A lot of things happen in the Report Manager using tiles. You add a new library by the means of the button + New library. After clicking on the button the template library tile appears.
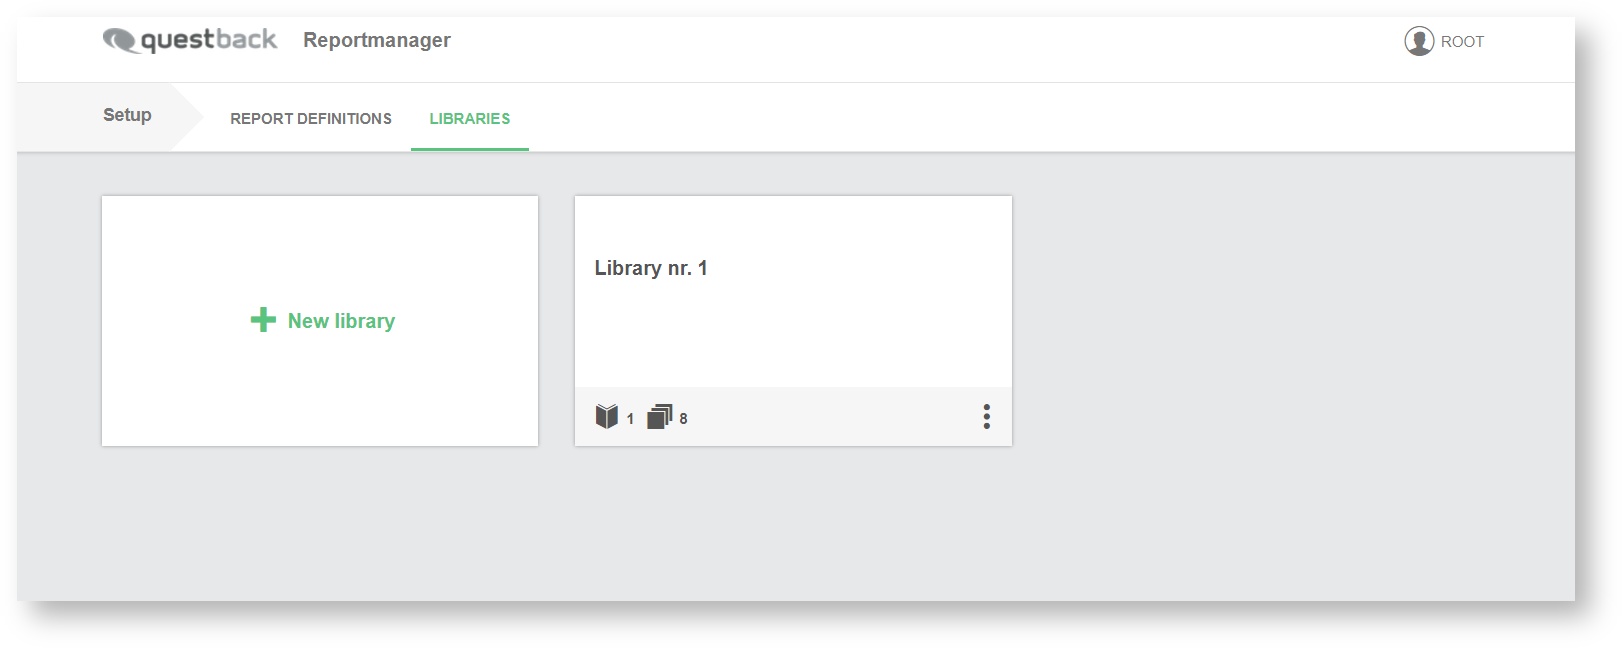
- The tile can be given a name by clicking on the row highlighted via mouseover.
- You confirm your naming with a green check mark or by clicking on the white area and reject it with the red X.
- In the lower left tile corner you find the icons informing about the number of files and slides and in the lower right hand corner you find the three dots menu for the delete command.
Tile layout II: Report Definition tile
Under the tab Report Definitions you click on + New report definition. The report definition tile appears:
- The tile layout is analogous to the layout of the library template tile.
- Moreover this tile has a status select box and contains the informations on the creation date and on the time of change.
- Besides the delete function, you find in the 3 dots menu possibility to duplicate the report definition.
- If your Report Definition exhibit, some invalid mappings the tile carries a red information sign.
- If you set the status to Published, you can select the Report Definition for the report order.
- Via mouseover, the information icons shows the sort information, which you enter into the text box. You find the text box on the sub-navigation field under the tab General settings.
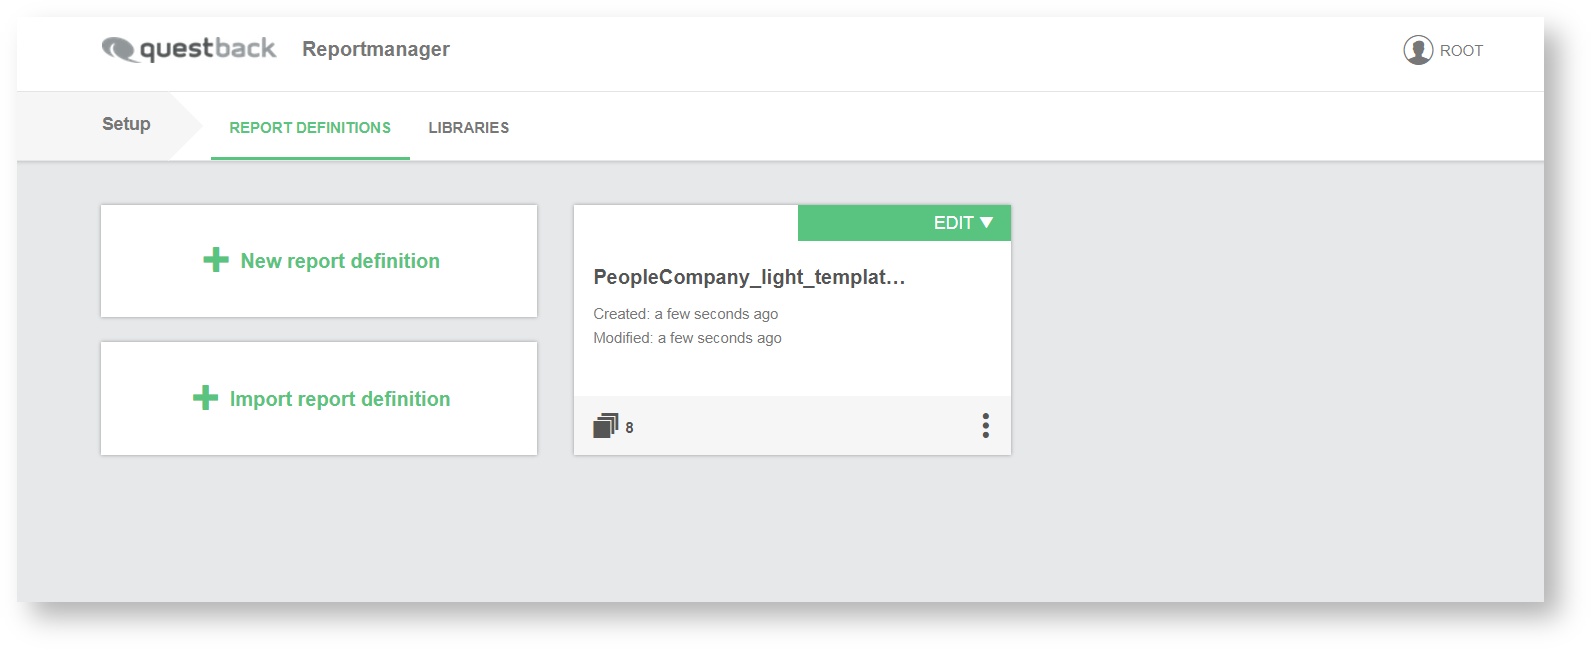
You set the definition to three statuses:
- Published
- Edit
- Draft
Information
If you set the status of the Report Definition to Draft or Published, the Report Definition can't be modifiied. This only possible if you set the status to Edit.
Tile layout III: Report Definition tile on the selection page
After selecting a report type, you have choosen a published Report Definition for ordering a report. This is done by clicking on the desired Report Definition tile on the selection page. This tile has only a very reduced layout.
- Name of the Report Definition
- Language of the Report Definition
- ID of the Report Definition
- Short description of the Report Definition (directly on tile)
Export & Import
If you want to export a Report Definition, you use the corresponding command in the 3 point menu of the Report Definition tile. To do this, you must set the status to Published.
- You define the location of your file by the means of the pop window.
To import a Report Definition, you click on the button + Import report definition. Again a pop up window opens and you select the desired file. It is worth knowing:
- The import is done including all the mappings and Collections as well as Dataspace Entities.
- Uploading a template under the tab Libraries is not necessary.
- You skip directly to the Report order.
Uploading a PPTX file
To create a Report Definition, you have to upload a PPTX file as a template under the tab Libraries. You take the following steps:
- On the configuration page you choose the tab Libraries.
- You click on the button + New Library and the library template tile appears.
- You continue with + New file (PPTX) and by the means of a pop up window you choose and upload the PPTX file prepared with Tagging Tool.
After uploading the desired file there are two ways to continue. The shorter of the two ways leads via the icon "Create report definition from template":
- The abbreviation offers you, apart from the time saving, a better handling.
- A master slide is created from the upload file, which cannot be split into individual slides.
- On the report definition page, you only work with the slide as a whole
The second way, on the other hand, opens up the possibility of working with several foils. So you don't use the icon "Create report definition from template", but jump back to the library page by clicking the back button, change the tab and click on + New Report Definition.
- The Report Definition tile appears. You quickly assign a name and another click takes you to the Report Definition overview page.
Related content
© 2024 Tivian XI GmbH